Visualise data. Amplify messages.
BAENG.IT transforms complex data and strategic narratives into visually compelling infographics that captivate, inform, and engage your target audience.
Maximum Information Density
High Engagement Potential
Enhancing Brand Authority

The Power of Visual Communication: Why Infographics Are Indispensable
65% of people are visual learners.
Content with images receive 94% more views.
The brain processes images 60,000 times faster.
Increases web traffic by up to 12%.
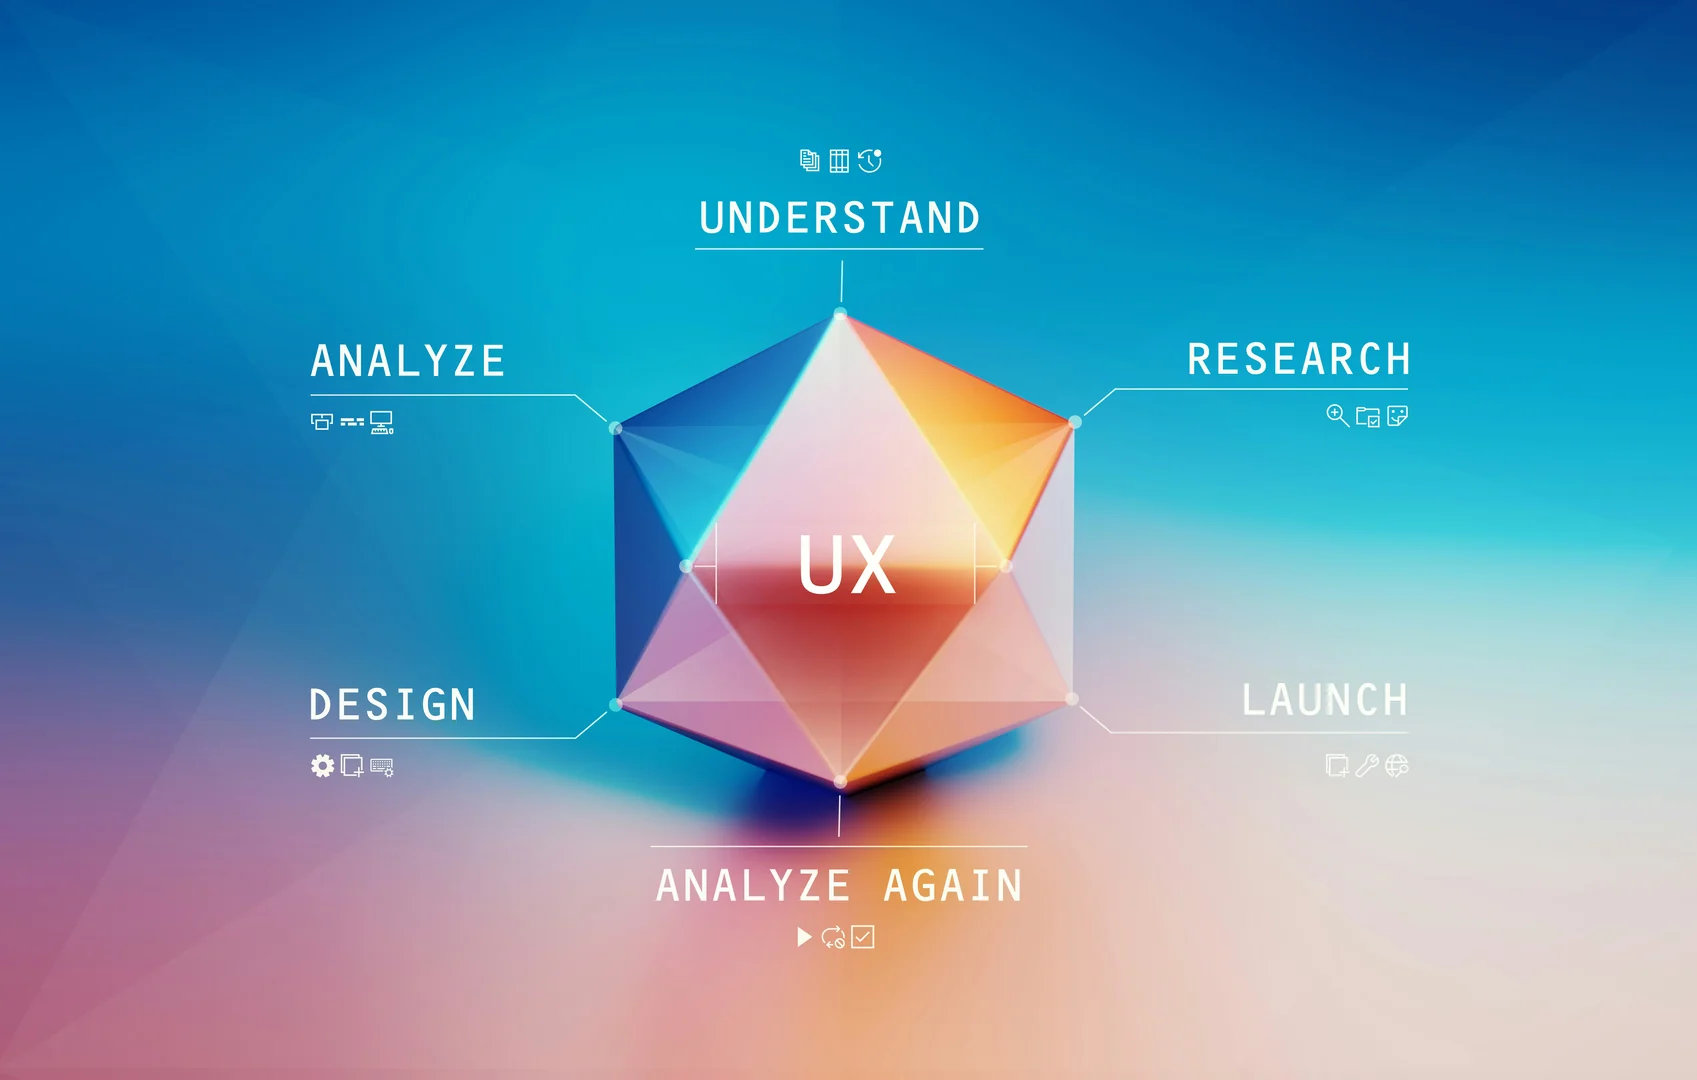
Strategic Concept: The Path to an Effective Infographic
An outstanding infographic doesn't begin with design but with a sound strategy. At BAENG.IT, we first analyse your core message, target audience, and overarching communication goal. We define clear Key Performance Indicators (KPIs) to make success measurable. This process includes identifying the most relevant data points and developing a narrative structure that logically and engagingly guides the viewer through the information. Only once this strategic foundation is in place—the story you want to tell—do we begin the visual implementation. This data-driven approach ensures that each infographic is not only aesthetically pleasing but, above all, supports your strategic business goals and delivers a measurable ROI, whether through lead generation, increasing brand awareness, or knowledge transfer.
Our Services
Infographic services in detail
Strategy concept
Objective definition, target audience analysis, and narrative development.
Data research
Thorough research and preparation of relevant data.
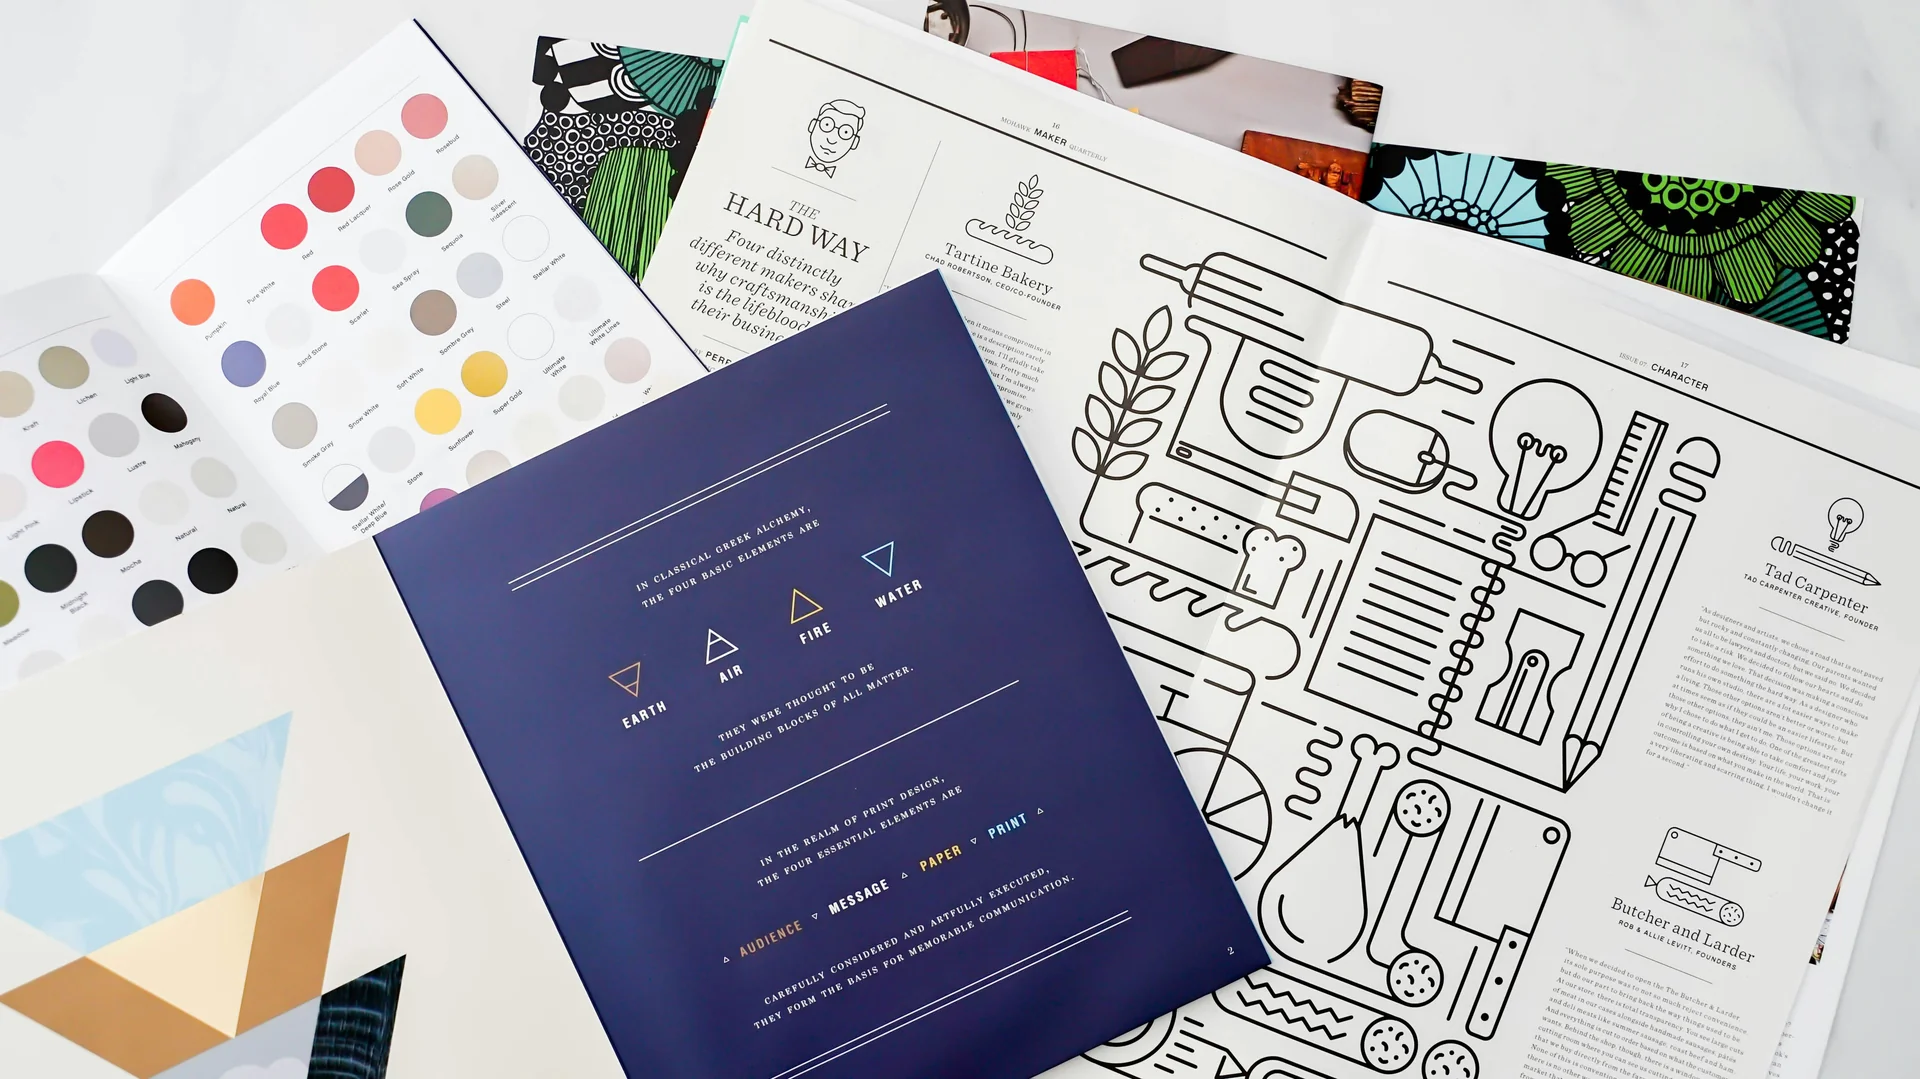
Creative Design
Unique visual concepts based on your corporate design.
SEO Optimization
Maximising visibility and link potential.
Interactive Graphic
Development of engaging, interactive web experiences.
Content Seeding
Targeted distribution to maximise reach.
Social Assets
Adaptation of the infographic for relevant channels.
Performance-Reporting
Detailed analysis and measurement of ROI.
Animation graphic
Creation of animated infographic videos.
From strategy to viral spread – we visualize your success.
Ready to handle your data
to bring to life?
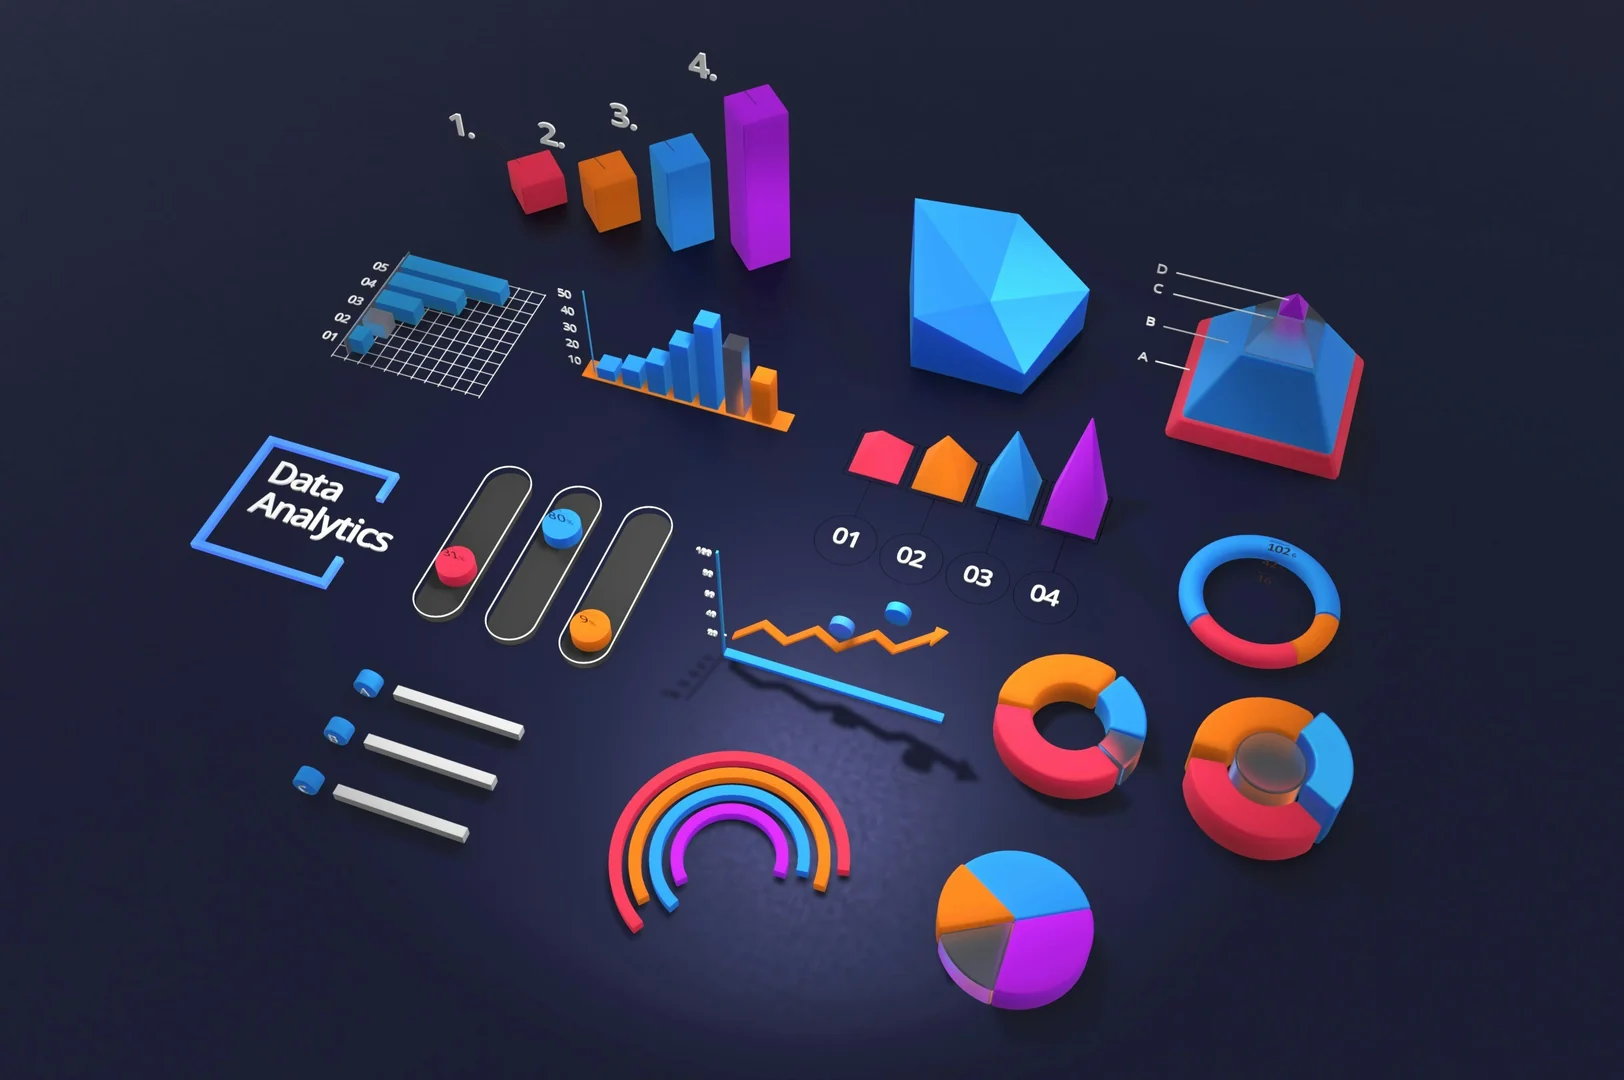
Data Visualisation & Design: Transforming Complexity into Clarity
The core of every infographic is the artful translation of complex data into an understandable and appealing visual language. Our design experts at BAENG.IT master this discipline excellently. We use psychological principles of colour theory, typography, and layout to create hierarchies and guide the viewer's gaze purposefully. Every chart, icon, and illustration is precisely selected and designed to not only present the data but to emphasise its significance. We strictly adhere to your corporate design to reinforce brand identity. The result is a visual symphony that reduces complexity, enables insights at first glance, and embeds your message sustainably in the memory of your target audience.
SEO and Content Marketing: The Infographic as a Link Magnet
Infographics are one of the most powerful tools in modern SEO and content marketing. Their high informational value and utility lead them to be shared more often than average and, more importantly, linked to by other high-quality websites. These organically generated backlinks are a crucial ranking factor for search engines like Google and enhance the authority of your entire domain. At BAENG.IT, we design infographics from the outset with this SEO potential in mind. This includes in-depth keyword research for accompanying texts, optimization of file names and alt tags, as well as developing a targeted seeding strategy to place the infographic with relevant influencers, bloggers, and journalists. This turns your infographic into a sustainable asset that continuously generates qualified traffic and valuable backlinks.
Applications: Versatility across all channels
The applications for professionally designed infographics are almost limitless and span the entire digital customer journey. Use them as central elements in blog posts to explain complex topics and increase the time spent on the page. On social media platforms like LinkedIn or Pinterest, they serve as shareable 'snackable content' formats that achieve high engagement rates. In email marketing, they can succinctly summarize complex product benefits or study results. Infographics also have a powerful impact in internal presentations or in whitepapers and business reports by conveying information quickly and effectively. BAENG.IT develops flexible design systems for you, allowing infographic elements to be modularly adapted for different channels and formats, ensuring consistent and efficient communication.
Measuring Success: Quantifying the ROI of Infographics
The value of an infographic must be measurable. At BAENG.IT, our work does not end with the delivery of the design. We implement precise tracking mechanisms to quantify the success of your investment. Key metrics include the number of social shares, the generated backlinks (using tools like Ahrefs or SEMrush), the increase in organic traffic to the landing page, as well as the dwell time and bounce rate. For lead generation goals, we measure the conversion rate, for example, when the infographic is downloaded in exchange for contact details. Through regular reports, we make the ROI transparent and derive data-driven recommendations for future content marketing measures. This ensures that every infographic makes a direct contribution to your business goals.
Creative
Content Development
Comprehensive
Branding
Advanced
SEO-Services
Interactive Infographics: The Next Level of Engagement
While static infographics are already highly effective, interactive infographics open up a new dimension of user experience. They invite the user to actively engage with the data, unlocking deeper layers of information through filter options or clickable elements. This exploratory approach significantly increases the time spent on your site and promotes a much deeper understanding of the topic. BAENG.IT designs and develops sophisticated interactive infographics using cutting-edge web technologies. These are excellently suited for presenting extensive datasets or complex processes. An interactive infographic is not just a piece of content, but a digital experience that positions your brand as an innovative leader.
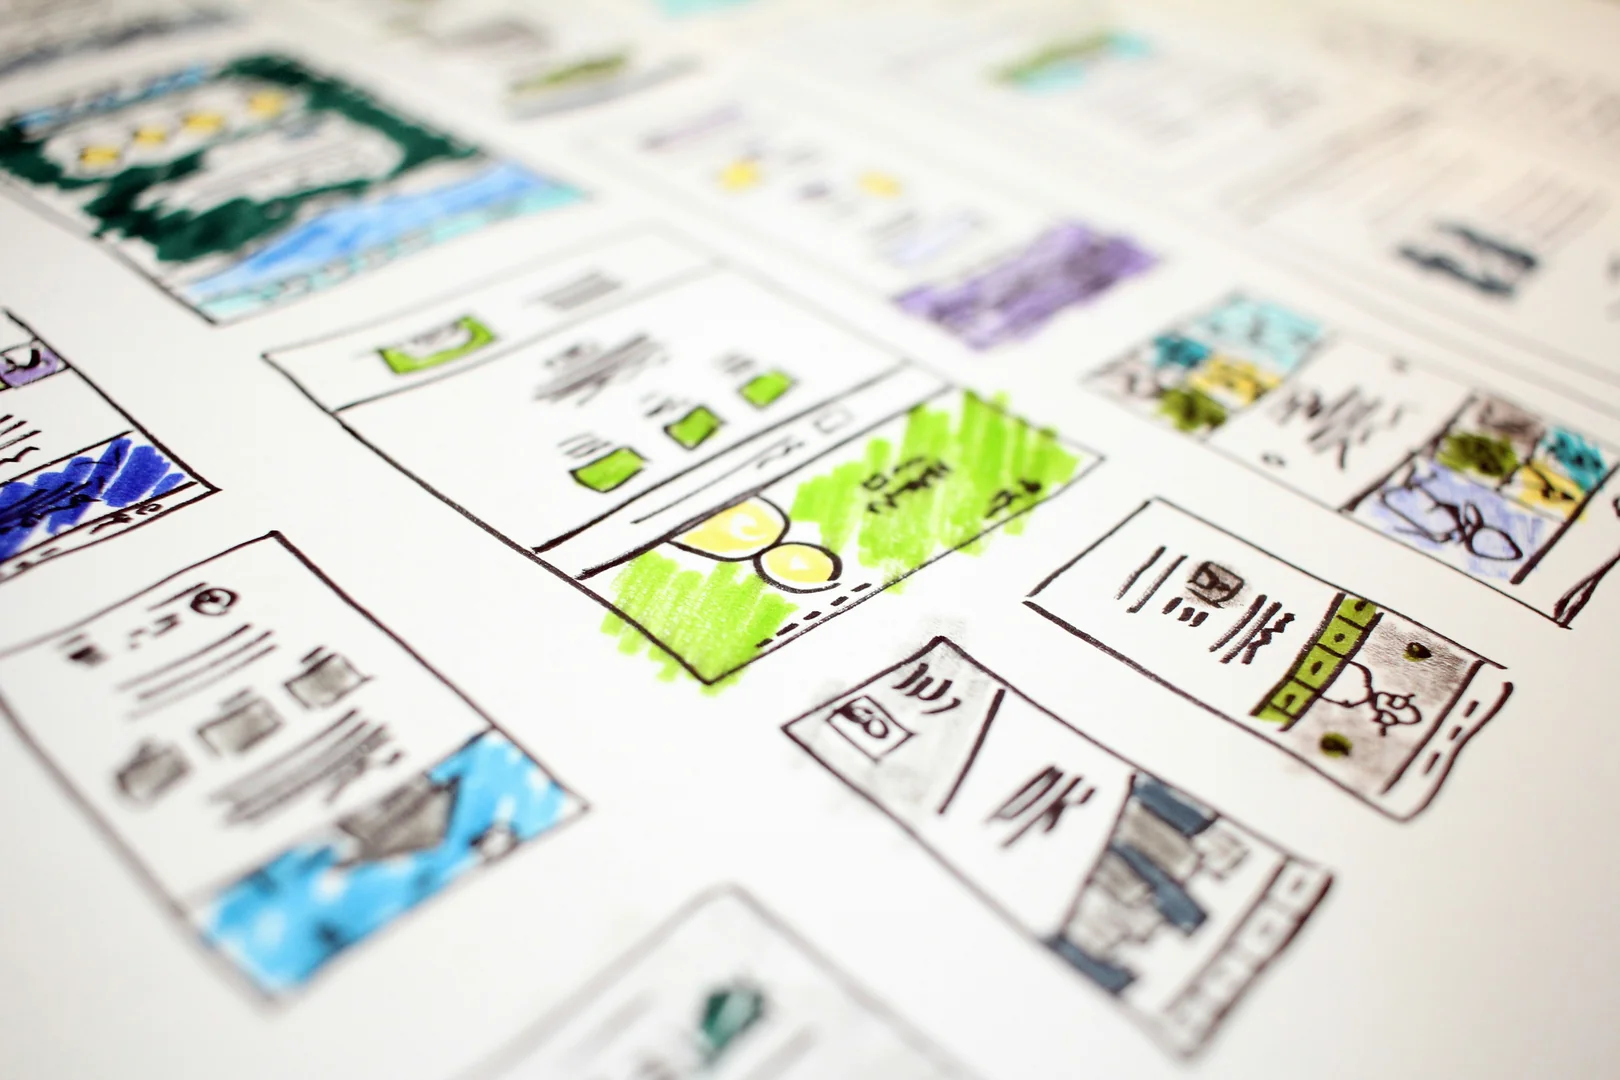
The BAENG.IT Process: From Idea to Finished Infographic
Our process is designed for maximum transparency, efficiency, and quality of results. It is divided into clearly defined phases: 1. Strategy Workshop: Together, we define goals, target audience, and core message. 2. Data and Content Research: We gather and structure all necessary information. 3. Conceptualisation & Wireframing: Developing the visual framework and narrative flow. 4. Design Phase: Refinement of the final design in close consultation with your corporate branding. 5. Feedback & Iteration: We incorporate your feedback through precise revision loops. 6. Final Delivery & Seeding: Provisioning in all formats and support for distribution. This structured process ensures that the final product exactly meets your expectations.
Best Practices for Unforgettable Infographics
To create an infographic that truly sticks in the memory, several best practices must be followed. Firstly: focus on a core message. Avoid covering too many topics. Secondly: tell a captivating story. Data should not only be presented but also embedded in a narrative context. Thirdly: create visual hierarchy. Use size, colour, and placement to highlight the most important information. Fourthly: quality over quantity. It's better to use fewer, but more meaningful data points. Fifthly: maintain brand consistency. The infographic must seamlessly integrate into your brand presence. BAENG.IT incorporates these principles into every project to ensure your infographic not only informs but also inspires and convinces.
How long does it take to create an infographic?
The success of infographics is deeply rooted in human cognitive psychology. Our brains are evolutionarily programmed to process visual information extremely quickly. Visual stimuli directly engage emotional centres, leading to better memory performance. Colours can influence moods, shapes convey meanings, and a clear layout reduces cognitive load. By strategically using these psychological levers, at BAENG.IT, we create infographics that are not only visually appealing but also optimally aligned with the functioning of the human brain. This maximises the clarity and persuasive power of your message.